Simple usage
Example: Creating a simple spreadsheet and bar chart
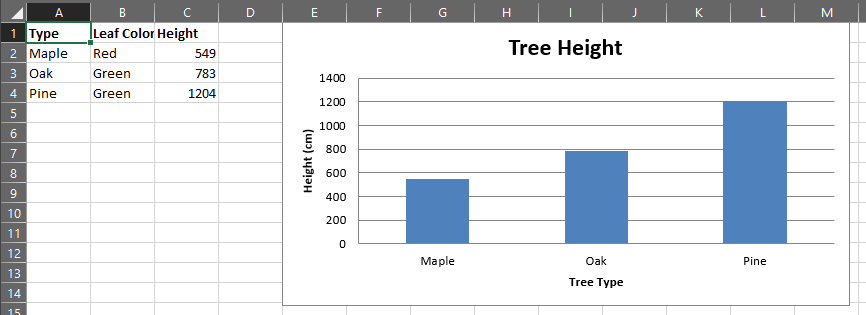
In this example we’re going to create a sheet from scratch and add some data and then plot it. We’ll also explore some limited cell style and formatting.
The data we’ll be entering on the sheet is below:
| Species | Leaf Color | Height (cm) |
|---|---|---|
| Maple | Red | 549 |
| Oak | Green | 783 |
| Pine | Green | 1204 |
To start, let’s load in openpyxl and create a new workbook. and get the active sheet. We’ll also enter our tree data.
>>> from openpyxl import Workbook
>>> wb = Workbook()
>>> ws = wb.active
>>> treeData = [["Type", "Leaf Color", "Height"], ["Maple", "Red", 549], ["Oak", "Green", 783], ["Pine", "Green", 1204]]
Next we’ll enter this data onto the worksheet. As this is a list of lists, we can simply use the Worksheet.append() function.
>>> for row in treeData:
...     ws.append(row)
Now we should make our heading Bold to make it stand out a bit more, to do that we’ll need to create a styles.Font and apply it to all the cells in our header row.
>>> from openpyxl.styles import Font
>>> ft = Font(bold=True)
>>> for row in ws["A1:C1"]:
...     for cell in row:
...         cell.font = ft
It’s time to make some charts. First, we’ll start by importing the appropriate packages from openpyxl.chart then define some basic attributes
>>> from openpyxl.chart import BarChart, Series, Reference
>>> chart = BarChart()
>>> chart.type = "col"
>>> chart.title = "Tree Height"
>>> chart.y_axis.title = 'Height (cm)'
>>> chart.x_axis.title = 'Tree Type'
>>> chart.legend = None
That’s created the skeleton of what will be our bar chart. Now we need to add references to where the data is and pass that to the chart object
>>> data = Reference(ws, min_col=3, min_row=2, max_row=4, max_col=3)
>>> categories = Reference(ws, min_col=1, min_row=2, max_row=4, max_col=1)
>>> chart.add_data(data)
>>> chart.set_categories(categories)
Finally we can add it to the sheet.
>>> ws.add_chart(chart, "E1")
>>> wb.save("TreeData.xlsx")
And there you have it. If you open that doc now it should look something like this