Advanced Options with Graphical Properties
Many advanced options require using the Graphical Properties of OOXML. This is a much more abstract API than the chart API itself and may require considerable studying of the OOXML specification to get right. It is often unavoidable to look at the XML source of some charts you’ve made. However, as openpyxl tries very hard to implement the OOXML specification correctly, you should be able to do most things quite easily. To things easier to read, openpyxl includes some aliases for some of the more obscure element or attribute names, eg. GraphicalProperties for `spPr or line for line.
Make the chart background transparent
from openpyxl.chart.shapes import GraphicalProperties
chart.graphical_properties = GraphicalProperties()
chart.graphical_properties.noFill = True
Remove the border from a chart
from openpyxl.chart.shapes import GraphicalProperties
chart.graphical_properties = GraphicalProperties()
chart.graphical_properties.line.noFill = True
chart.graphical_properties.line.prstDash = None
Reusing XML
Due to the high degree of abstraction, DrawingML is used in different office programs, it can be tedious and frustrating to set the relevant properties for the desired effect. Fortunately, because openpyxl is very close to the specification, it is often possible to use XML from source. For example, adding a single, formatted data label to a series.
xml = """
<txPr>
<a:bodyPr wrap="square" lIns="38100" tIns="19050" rIns="38100" bIns="19050" anchor="ctr" xmlns:a="http://schemas.openxmlformats.org/drawingml/2006/main">
<a:spAutoFit />
</a:bodyPr>
<a:lstStyle xmlns:a="http://schemas.openxmlformats.org/drawingml/2006/main" />
<a:p xmlns:a="http://schemas.openxmlformats.org/drawingml/2006/main">
<a:pPr>
<a:defRPr>
<a:solidFill>
<a:srgbClr val="0070C0" />
</a:solidFill>
</a:defRPr>
</a:pPr>
<a:endParaRPr lang="de-DE" />
</a:p>
</txPr>
"""
from openpyxl.chart.text import RichText
from openpyxl.xml.functions import fromstring
xml = fromstring(txt)
text_props = RichText.from_tree(xml)
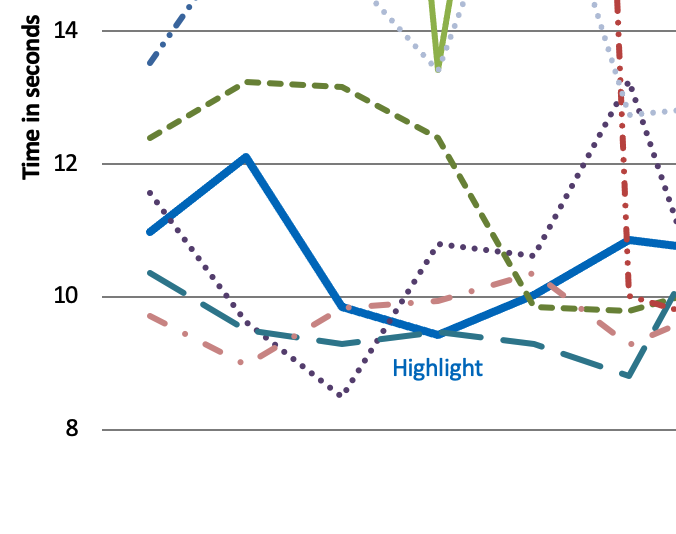
# Assuming that this is for the third data series for a chart and we want to add a label below the fourth data point.
highlight = chart.series[2]
highlight.graphicalProperties.line.prstDash = "solid"
highlight.graphicalProperties.ln.solidFill = "0070C0"
highlight.graphicalProperties.line.width = 40000 # make the line thicker than normal
highlight.dLbls = DataLabelList()
highlight = DataLabel(idx=3, showSerName=True, dLblPos="b", txPr=text_props)
highlight.dLbls.dLbl.append(label)