Pie Charts
Pie Charts
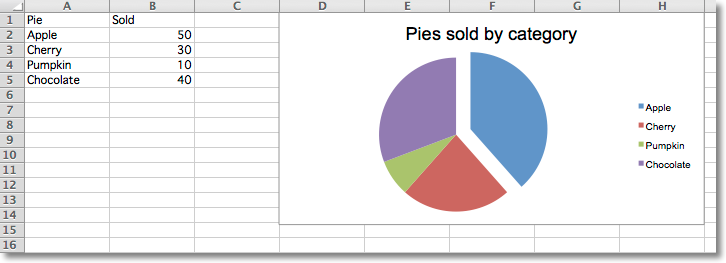
Pie charts plot data as slices of a circle with each slice representing the percentage of the whole. Slices are plotted in a clockwise direction with 0° being at the top of the circle. Pie charts can only take a single series of data. The title of the chart will default to being the title of the series.
from openpyxl import Workbook

from openpyxl.chart import (
    PieChart,
    ProjectedPieChart,
    Reference
)
from openpyxl.chart.series import DataPoint

data = [
    ['Pie', 'Sold'],
    ['Apple', 50],
    ['Cherry', 30],
    ['Pumpkin', 10],
    ['Chocolate', 40],
]

wb = Workbook()
ws = wb.active

for row in data:
    ws.append(row)

pie = PieChart()
labels = Reference(ws, min_col=1, min_row=2, max_row=5)
data = Reference(ws, min_col=2, min_row=1, max_row=5)
pie.add_data(data, titles_from_data=True)
pie.set_categories(labels)
pie.title = "Pies sold by category"

# Cut the first slice out of the pie
slice = DataPoint(idx=0, explosion=20)
pie.series[0].data_points = [slice]

ws.add_chart(pie, "D1")


ws = wb.create_sheet(title="Projection")

data = [
    ['Page', 'Views'],
    ['Search', 95],
    ['Products', 4],
    ['Offers', 0.5],
    ['Sales', 0.5],
]

for row in data:
    ws.append(row)

projected_pie = ProjectedPieChart()
projected_pie.type = "pie"
projected_pie.splitType = "val" # split by value
labels = Reference(ws, min_col=1, min_row=2, max_row=5)
data = Reference(ws, min_col=2, min_row=1, max_row=5)
projected_pie.add_data(data, titles_from_data=True)
projected_pie.set_categories(labels)

ws.add_chart(projected_pie, "A10")

from copy import deepcopy
projected_bar = deepcopy(projected_pie)
projected_bar.type = "bar"
projected_bar.splitType = 'pos' # split by position

ws.add_chart(projected_bar, "A27")

wb.save("pie.xlsx")
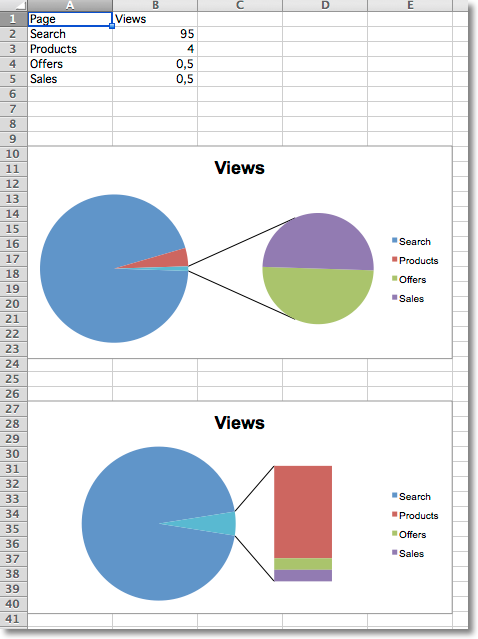
Projected Pie Charts
Projected pie charts extract some slices from a pie chart and project them into a second pie or bar chart. This is useful when there are several smaller items in the data series. The chart can be split according to percent, val(ue) or pos(ition). If nothing is set then the application decides which to use. In addition custom splits can be defined.
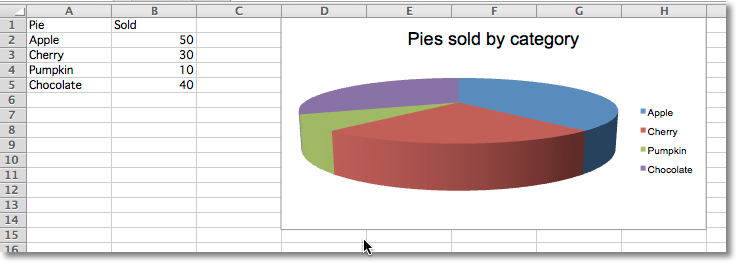
3D Pie Charts
Pie charts can also be created with a 3D effect.
from openpyxl import Workbook

from openpyxl.chart import (
    PieChart3D,
    Reference
)

data = [
    ['Pie', 'Sold'],
    ['Apple', 50],
    ['Cherry', 30],
    ['Pumpkin', 10],
    ['Chocolate', 40],
]

wb = Workbook()
ws = wb.active

for row in data:
    ws.append(row)

pie = PieChart3D()
labels = Reference(ws, min_col=1, min_row=2, max_row=5)
data = Reference(ws, min_col=2, min_row=1, max_row=5)
pie.add_data(data, titles_from_data=True)
pie.set_categories(labels)
pie.title = "Pies sold by category"


ws.add_chart(pie, "D1")

wb.save("pie3D.xlsx")
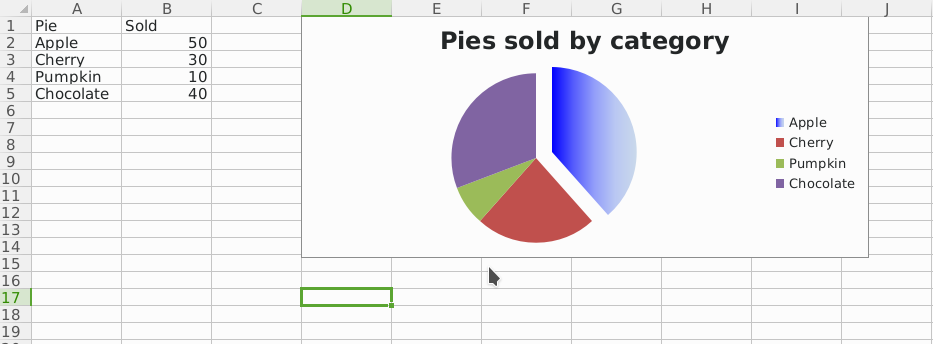
Gradient Pie Charts
Pie charts can also be created with gradient series.
from openpyxl import Workbook

from openpyxl.chart import (
    PieChart,
    Reference
)
from openpyxl.chart.series import DataPoint
from openpyxl.chart.shapes import GraphicalProperties
from openpyxl.drawing.fill import (
    GradientFillProperties,
    GradientStop,
    LinearShadeProperties
)
from openpyxl.drawing.colors import SchemeColor

data = [
    ['Pie', 'Sold'],
    ['Apple', 50],
    ['Cherry', 30],
    ['Pumpkin', 10],
    ['Chocolate', 40],
]

wb = Workbook()
ws = wb.active

for row in data:
    ws.append(row)

pie = PieChart()
labels = Reference(ws, min_col=1, min_row=2, max_row=5)
data = Reference(ws, min_col=2, min_row=1, max_row=5)
pie.add_data(data, titles_from_data=True)
pie.set_categories(labels)
pie.title = "Pies sold by category"

# Cut the first slice out of the pie and apply a gradient to it
slice = DataPoint(
    idx=0,
    explosion=20,
    spPr=GraphicalProperties(
        gradFill=GradientFillProperties(
            gsLst=(
                GradientStop(
                    pos=0,
                    prstClr='blue'
                ),
                GradientStop(
                    pos=100000,
                    schemeClr=SchemeColor(
                        val='accent1',
                        lumMod=30000,
                        lumOff=70000
                    )
                )
            )
        )
    )
)
pie.series[0].data_points = [slice]

ws.add_chart(pie, "D1")

wb.save("pie.xlsx")