Changing the layout of plot area and legend
The layout of the chart within the canvas can be set by using the layout property an instance of a layout class.
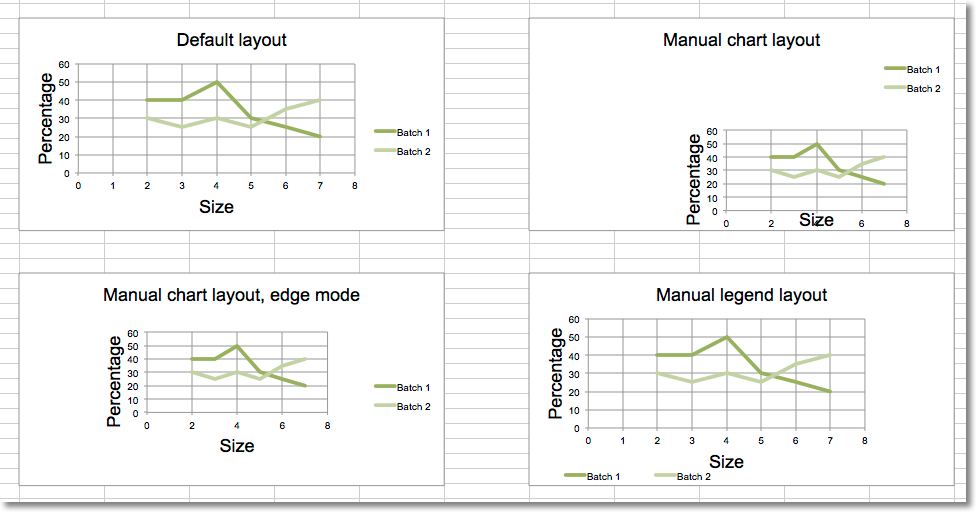
Chart layout
Size and position
The chart can be positioned within its container. x and y adjust
position, w and h adjust the size . The units are proportions of the
container. A chart cannot be positioned outside of its container and the
width and height are the dominant constraints: if x + w > 1, then x = 1 - w.
x is the horizontal position from the left y is the vertical position the top h is the height of the chart relative to its container w is the width of the box
Mode
In addition to the size and position the mode for the relevant attribute can also be set to either factor or edge. Factor is the default:
layout.xMode = edge
Target
The layoutTarget can be set to outer or inner. The default is outer:
layout.layoutTarget = inner
Legend layout
The position of the legend can be controlled either by setting its position:
r, l, t, b, and tr, for right, left, top, bottom and top
right respectively. The default is r.
legend.position = 'tr'
or applying a manual layout:
legend.layout = ManualLayout()
from openpyxl import Workbook, load_workbook
from openpyxl.chart import ScatterChart, Series, Reference
from openpyxl.chart.layout import Layout, ManualLayout

wb = Workbook()
ws = wb.active

rows = [
    ['Size', 'Batch 1', 'Batch 2'],
    [2, 40, 30],
    [3, 40, 25],
    [4, 50, 30],
    [5, 30, 25],
    [6, 25, 35],
    [7, 20, 40],
]

for row in rows:
    ws.append(row)

ch1 = ScatterChart()
xvalues = Reference(ws, min_col=1, min_row=2, max_row=7)
for i in range(2, 4):
    values = Reference(ws, min_col=i, min_row=1, max_row=7)
    series = Series(values, xvalues, title_from_data=True)
    ch1.series.append(series)


ch1.title = "Default layout"
ch1.style = 13
ch1.x_axis.title = 'Size'
ch1.y_axis.title = 'Percentage'
ch1.legend.position = 'r'

ws.add_chart(ch1, "B10")

from copy import deepcopy

# Half-size chart, bottom right
ch2 = deepcopy(ch1)
ch2.title = "Manual chart layout"
ch2.legend.position = "tr"
ch2.layout=Layout(
    manualLayout=ManualLayout(
        x=0.25, y=0.25,
        h=0.5, w=0.5,
    )
)
ws.add_chart(ch2, "H10")

# Half-size chart, centred
ch3 = deepcopy(ch1)
ch3.layout = Layout(
    ManualLayout(
    x=0.25, y=0.25,
    h=0.5, w=0.5,
    xMode="edge",
    yMode="edge",
    )
)
ch3.title = "Manual chart layout, edge mode"
ws.add_chart(ch3, "B27")

# Manually position the legend bottom left
ch4 = deepcopy(ch1)
ch4.title = "Manual legend layout"
ch4.legend.layout = Layout(
    manualLayout=ManualLayout(
        yMode='edge',
        xMode='edge',
        x=0, y=0.9,
        h=0.1, w=0.5
    )
)

ws.add_chart(ch4, "H27")

wb.save("chart_layout.xlsx")
This produces four charts illustrating various possibilities: